ObserveOne and Pingdom both monitor websites, but with different philosophies. Pingdom is a classic uptime and performance tool from SolarWinds covering HTTP checks, page speed, and Real User Monitoring. ObserveOne is a production monitoring platform with multi-region uptime checks, incident management, heartbeats, and Autopilot, which generates and runs Playwright test suites from a URL. This post compares the two so you can decide which job you are hiring the tool for.
At a Glance: Uptime vs Incidents#
| Feature | ObserveOne | Pingdom |
|---|---|---|
| Primary Use Case | Website monitoring + incident management | Classic uptime + performance monitoring |
| Uptime Checks | URL Monitors (multi-region) | HTTP(S) checks (per-region probes) |
| Synthetic Journeys | Autopilot (paste a URL, AI generates Playwright) | Transactions (script-based) |
| Self-Healing | LLM healer agent re-fixes broken tests | Not available |
| Incident Management | Built-in (priority, assignee, timeline, auto-resolution) | Not available (alerts only) |
| CI Integration | GitHub App + GitLab (checks, PR/MR comments) | Not available |
| Alert Channels | 7 types (Email, Slack, Discord, Teams, Telegram, SMS, Webhook) | Email + webhook |
| Status Pages | Public pages with incident details | Public pages (uptime-only, basic) |
| Heartbeats / Cron Monitoring | Yes | Not available |
| API Monitoring | Multi-region with JSONPath validation | Basic via Transaction scripts |
Pingdom excels at classic uptime monitoring with HTTP(S) checks and script-based Transactions. ObserveOne focuses on production monitoring with incidents, heartbeats, and Autopilot, which writes and self-heals Playwright suites and gates CI. The question is not "which is better" but "which job are you hiring it for."
Pricing Snapshot#
Pricing below reflects public ObserveOne pricing as of March 2026. Pingdom pricing is package-based (uptime, synthetic, and RUM bundles); final cost depends on selected modules and usage limits.
| Plan | $/mo (monthly) | $/mo (annual) | AI verification runs | Monitors | Check interval | Users |
|---|---|---|---|---|---|---|
| Free | $0 | $0 | 10 | 10 | every 2h | 1 |
| Starter | $7 | $6 | 25 | 25 | every 5m | 1 |
| Essential | $29 | $24 | 80 | 50 | every 60s | 1 |
| Small Team | $99 | $85 | 200 | 500 | every 30s | 10 |
Pingdom has no free tier (30-day trial only). Plans start around $16.5/mo (verified pingdom.com/pricing, 2026-10-02), but the real cost varies by uptime/synthetic package composition, check volume, and add-ons; enterprise scope is negotiated.
For current Pingdom pricing math, verify directly on the vendor pricing page before purchase.
What Pingdom Does Well#
Pingdom has clear strengths where ObserveOne does not compete directly.
Classic Uptime Checks#
Pingdom offers single-URL HTTP(S) checks: name the check, add the URL, set an interval, and pick a region (North America, Europe, Asia Pacific, or Latin America). You get response-time charts with max/min/avg, probe-level filtering, and uptime percentage with "up since" timestamps.

Pingdom's uptime checks table: up/down status and response time.
The main limitation is one region per check. To cover North America and Europe, you create separate checks and manage them separately. ObserveOne supports multiple regions per check: one URL Monitor runs from several locations and gives you a single view of availability and response time, no duplicate checks needed.
Transactions: Script-Based Synthetic Checks#
Pingdom calls their browser-based synthetic journeys "Transactions." You write scripts using a custom command language with autocomplete support.

Autocomplete showing available commands like click, fill field, submit form, wait for element.
What works well:
- Command autocomplete with clear syntax makes actions easy to discover (
go to url,click,fill field,submit form,wait for element) - Separate validation commands (
URL should be,element should exist,element should contain text) keep assertions organized - Auto-filling of values: selecting
URL should beinserts the current URL into the validation line - Instant execution feedback: each command shows execution time in a small green pill
Limitations:
- Feels more script-y than visual; you write code rather than describe intent, and there is no AI to plan the flow for you
- The empty state uses a marketing-heavy video intro instead of a quick-start wizard
- Transaction results reuse the uptime-check layout (response-time graphs, uptime percentage). You do not get a step-by-step breakdown of which action or assertion failed
For developers comfortable with code, Pingdom's Transactions work well enough. But if you would rather paste a URL and let AI generate the suite, ObserveOne's Autopilot is lighter to start.
Page Speed: Deep Performance Analysis#
Page Speed is where Pingdom stands out, with comprehensive page load performance testing.

Performance grade (B 87/100) with load time, page size, requests, and historical comparison.
You get a letter grade (A to F) with a numeric score, a filmstrip of page load progression, and a waterfall timeline per resource (DNS, SSL, connect, send, wait, receive). Content breaks down by type and domain, and you can compare against previous periods to spot regressions. It is a dense, powerful tool for developers who need deep load-behavior insight.
Real User Monitoring (RUM)#
Pingdom's RUM tracks live traffic by embedding a JavaScript snippet on your site. You get real-time metrics (active sessions, load time, pageviews/min, bounce rate, Apdex score), configurable "satisfied load time" thresholds, and geography-based performance breakdowns.
RUM is the right tool for understanding how actual users experience your site. To validate that your checkout flow functions correctly on a schedule, that is where ObserveOne's Autopilot suites come in.
Email Reports & Report Banners#
Pingdom provides two features for sharing monitoring data:
- Email Reports: scheduled uptime or page speed summaries sent to specific subscribers. You choose report type, send time, and which checks to include.
- Report Banners: embeddable widgets showing uptime or response time for a date range, with both direct URL and HTML embed code.

Create shareable performance badges for external sites.
Maintenance Windows#
You can schedule alert suppression during planned maintenance by setting a description, start time, duration, repeat options, and which checks to pause. This prevents alert noise during known downtime. ObserveOne does not have this, so you would manually disable monitors or mute alert channels temporarily.
What ObserveOne Adds on Top of Classic Uptime#
ObserveOne was not built to clone Pingdom's uptime checks. It focuses on production monitoring and incident-driven workflows, plus AI-generated Playwright tests. Here is what you get that Pingdom does not offer.
Autopilot: AI-Generated Playwright Tests Instead of Hand-Written Scripts#
The clearest difference between the two platforms is how synthetic journeys are built.
Pingdom approach: hand-write scripts in a custom command language, line by line:
go to url observeone.comfill field username user123fill field password secretclick button#submitURL should be /dashboardelement should exist div.welcome-message
go to url observeone.comfill field username user123fill field password secretclick button#submitURL should be /dashboardelement should exist div.welcome-message
ObserveOne approach: paste a URL. Autopilot plans the user flows and generates a real Playwright suite. When the app changes and a test breaks, an LLM healer agent re-fixes it automatically. Suites run on a schedule and gate your CI through the GitHub App or GitLab, posting status checks and PR/MR comments. The generated scripts are real, editable Playwright you can keep.
Why it matters:
- No script authoring: no custom command syntax to memorize; the AI writes the suite from a URL
- Self-healing: when the app changes and tests break, the healer agent re-fixes them instead of leaving you to rewrite scripts
- Real Playwright that gates CI: generated tests are editable Playwright, run on a schedule, and block merges via GitHub App / GitLab status checks and PR/MR comments
Pingdom's Transaction scripts work and have good autocomplete. But ObserveOne's Autopilot removes the need to author and maintain the scripts yourself.
Incidents, Not Just Alerts#
This is the architectural difference that defines ObserveOne's approach.
Pingdom: when a check fails, you get an alert (email or webhook). There is no central incident object tracking the problem lifecycle.
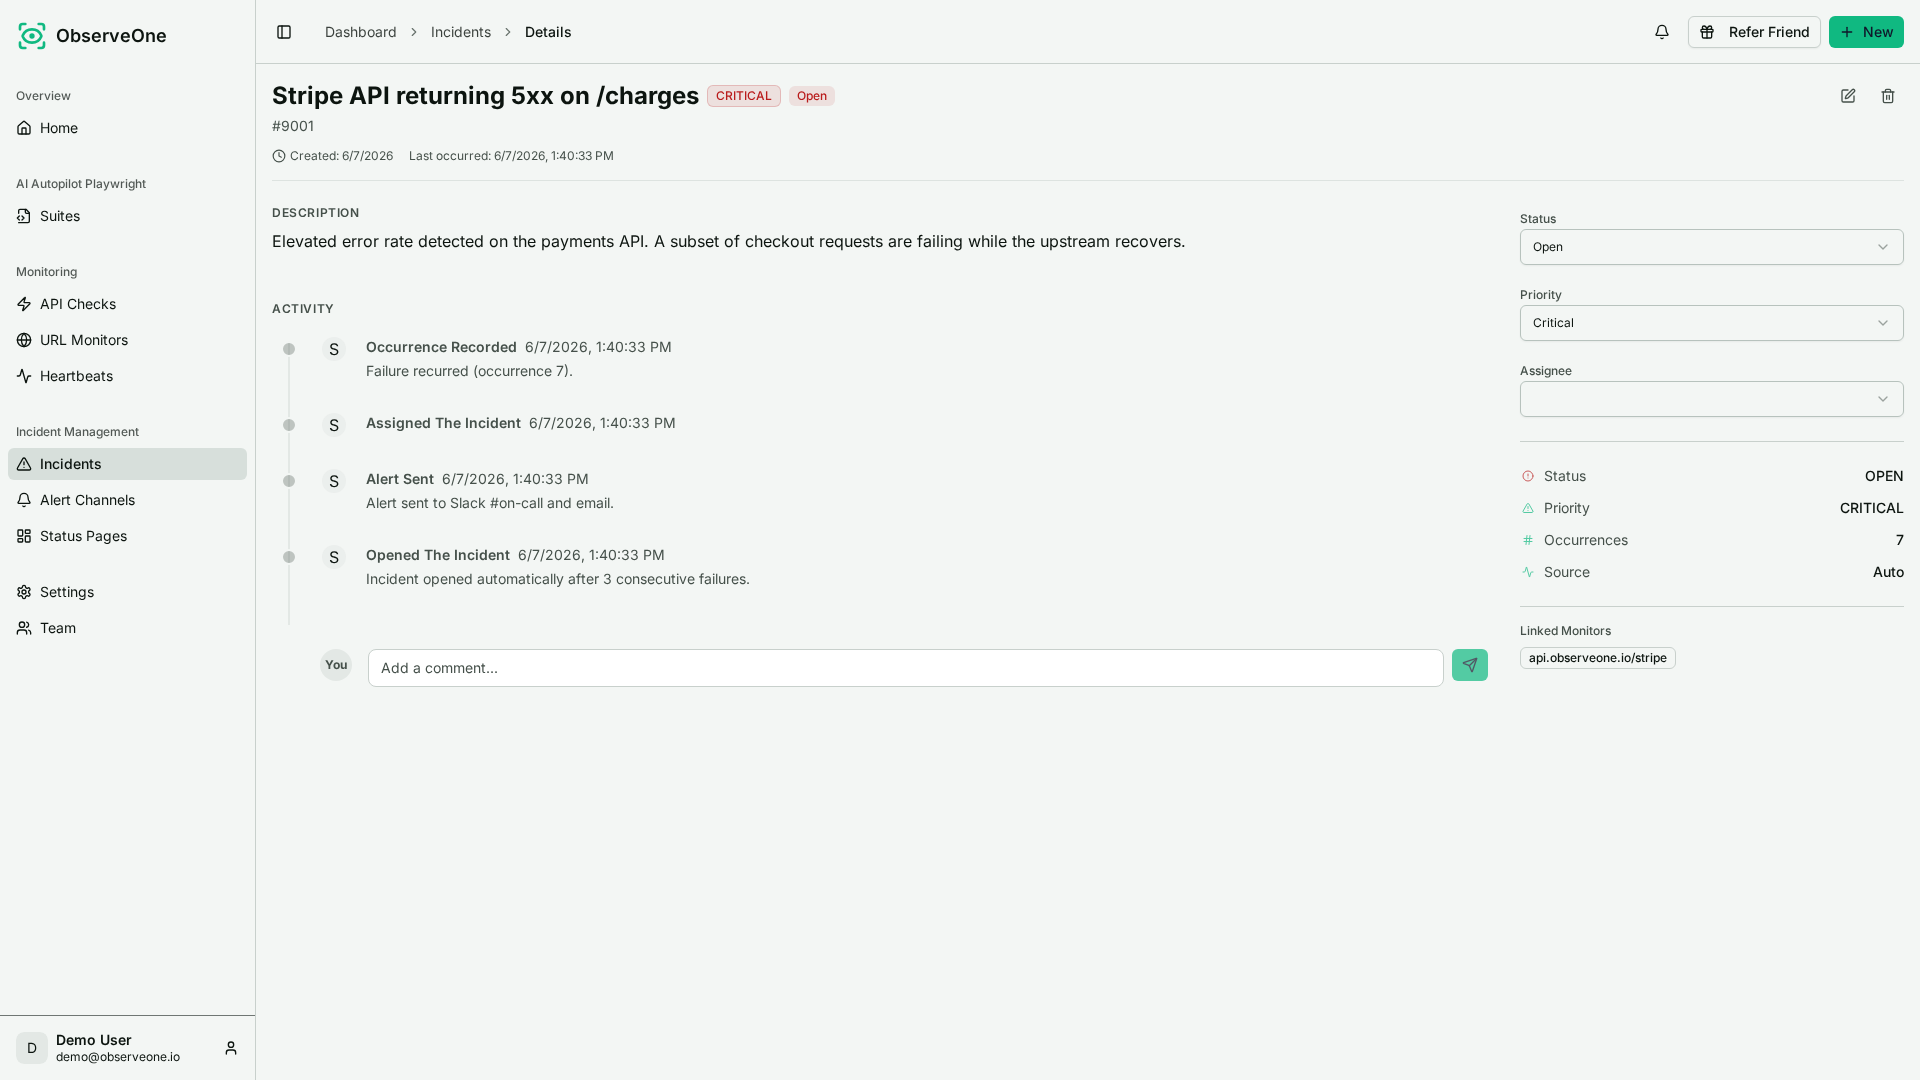
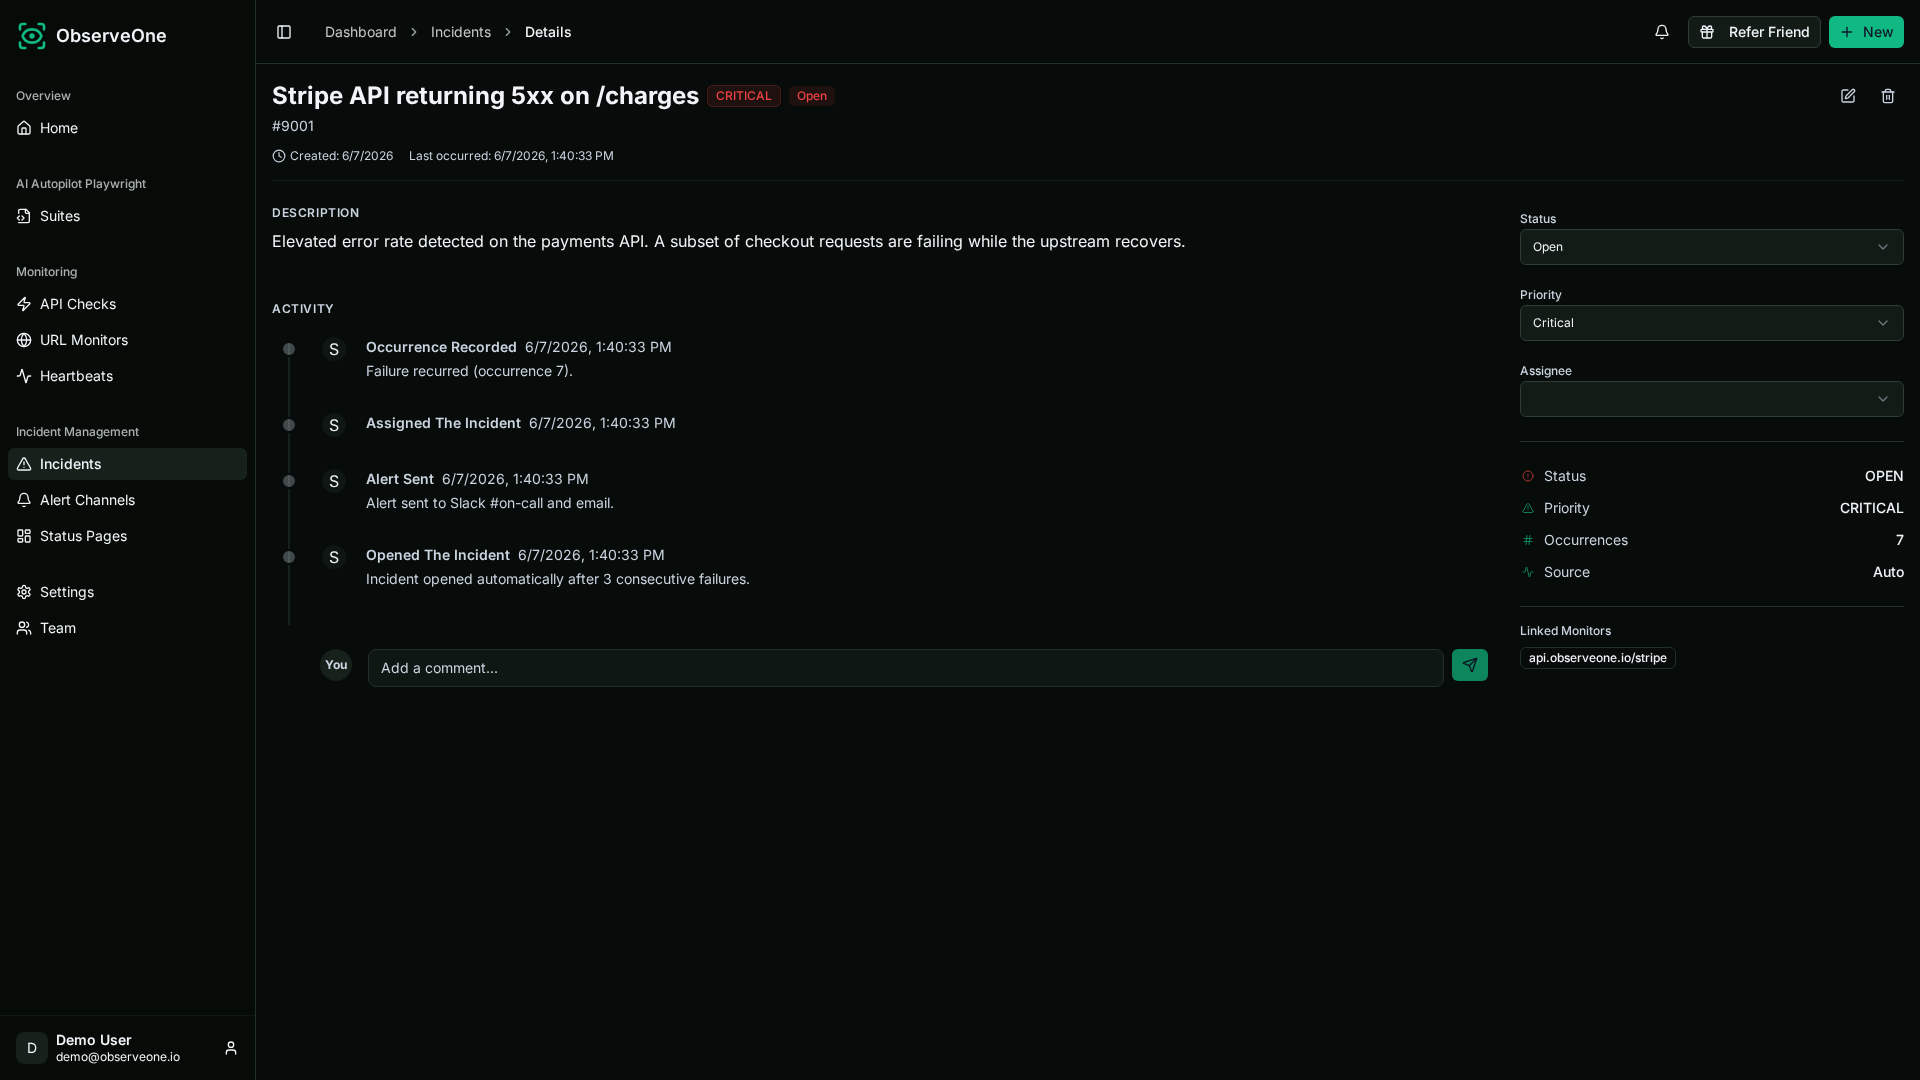
ObserveOne: check failures automatically create incidents with:
- Priority levels (Critical, High, Medium, Low) for triage
- Assignment workflow to delegate to team members
- Timeline of all related alerts from multiple monitors
- Linked monitors showing which checks are involved
- Auto-resolution when monitors recover
Why it matters:
- Centralizes related failures (an API check and a URL monitor can feed the same incident)
- Provides an audit trail and resolution tracking for post-mortems
- Built for on-call workflows, not just alerting
ObserveOne treats incidents as first-class objects with priority and ownership. Pingdom handles alerting but leaves incident management to external tools.
Heartbeats for Cron Jobs and Background Work#
Pingdom does not cover this category at all. Give your cron job, backup script, or ETL pipeline a unique ping URL. If it does not ping on schedule, ObserveOne creates an incident.
Use cases:
- Database backups that must run nightly
- Report generation jobs
- Data sync pipelines
- Scheduled cleanup tasks
Pingdom equivalent: none. You would need a separate tool like Cronitor or BetterUptime. Uptime checks cannot detect "silent failures" where a service is up but a job did not run.
Richer Alert Channels & Status Pages#
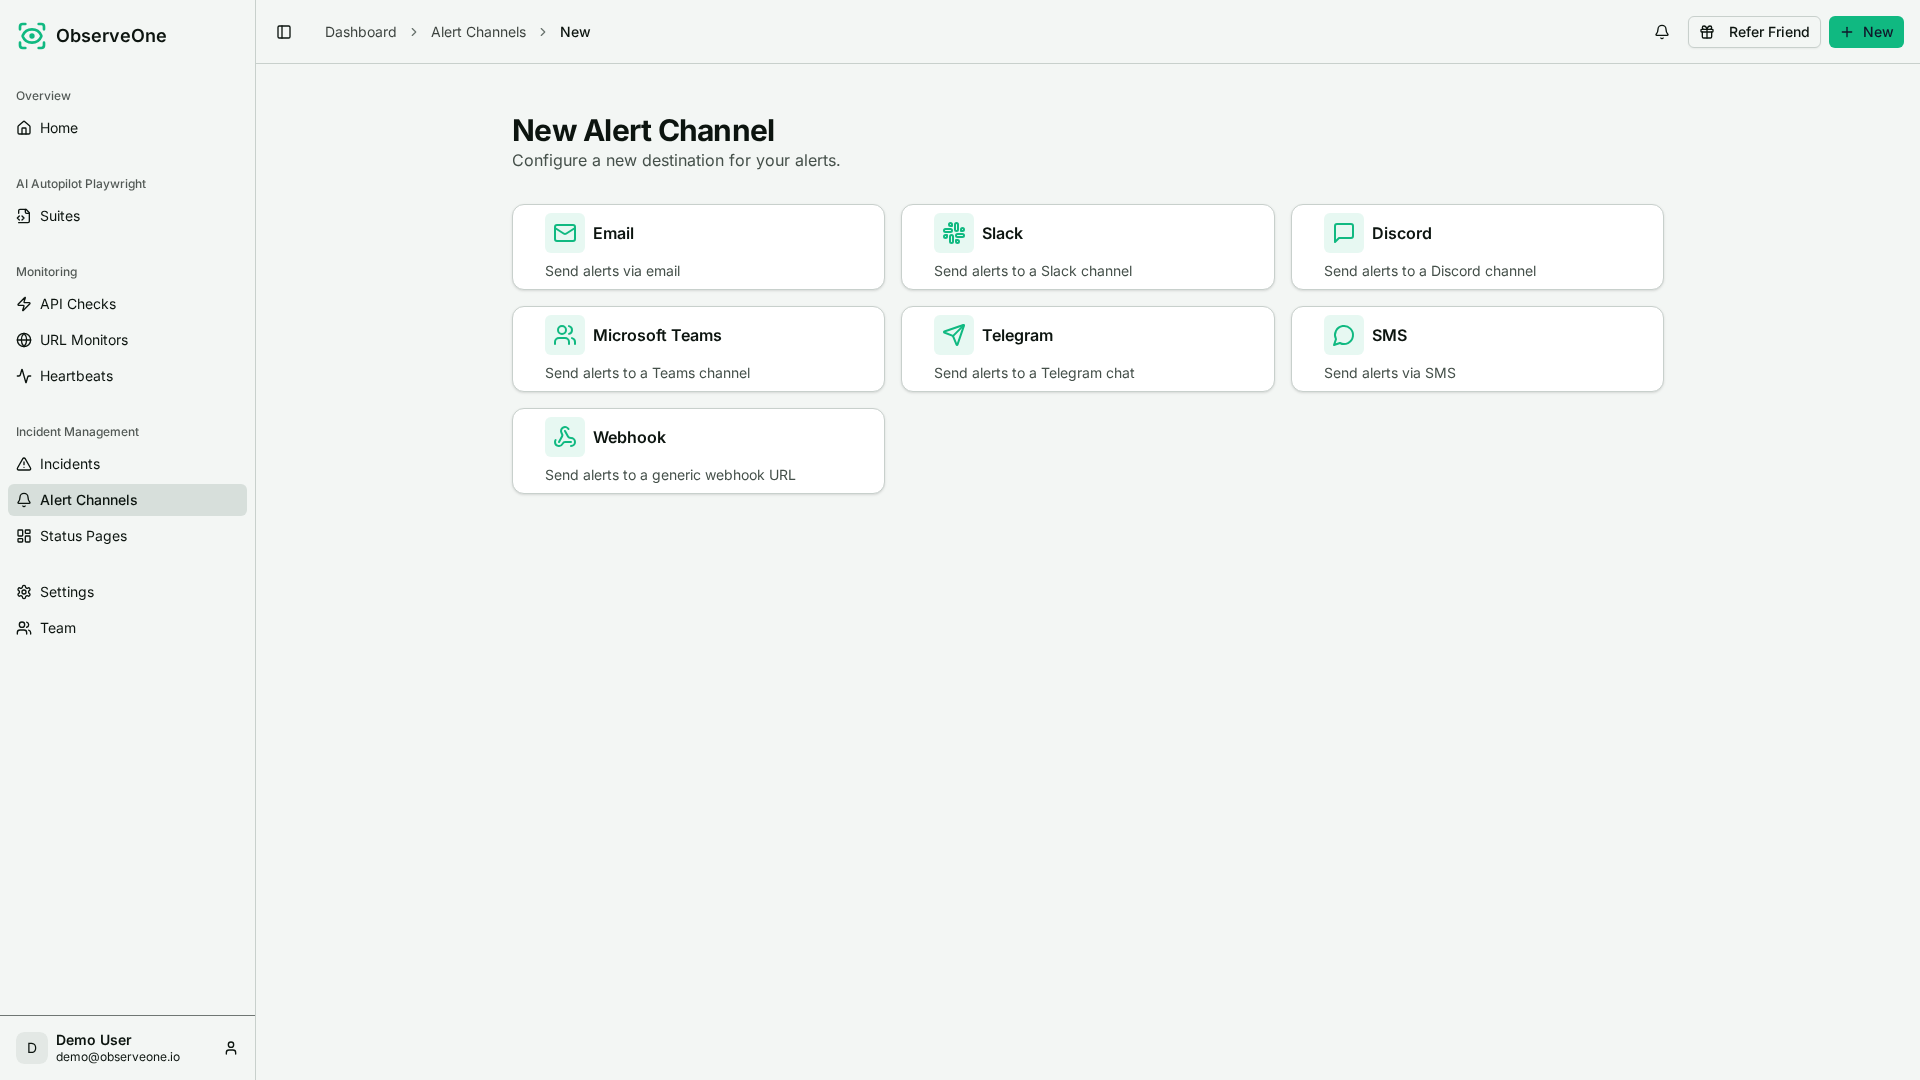
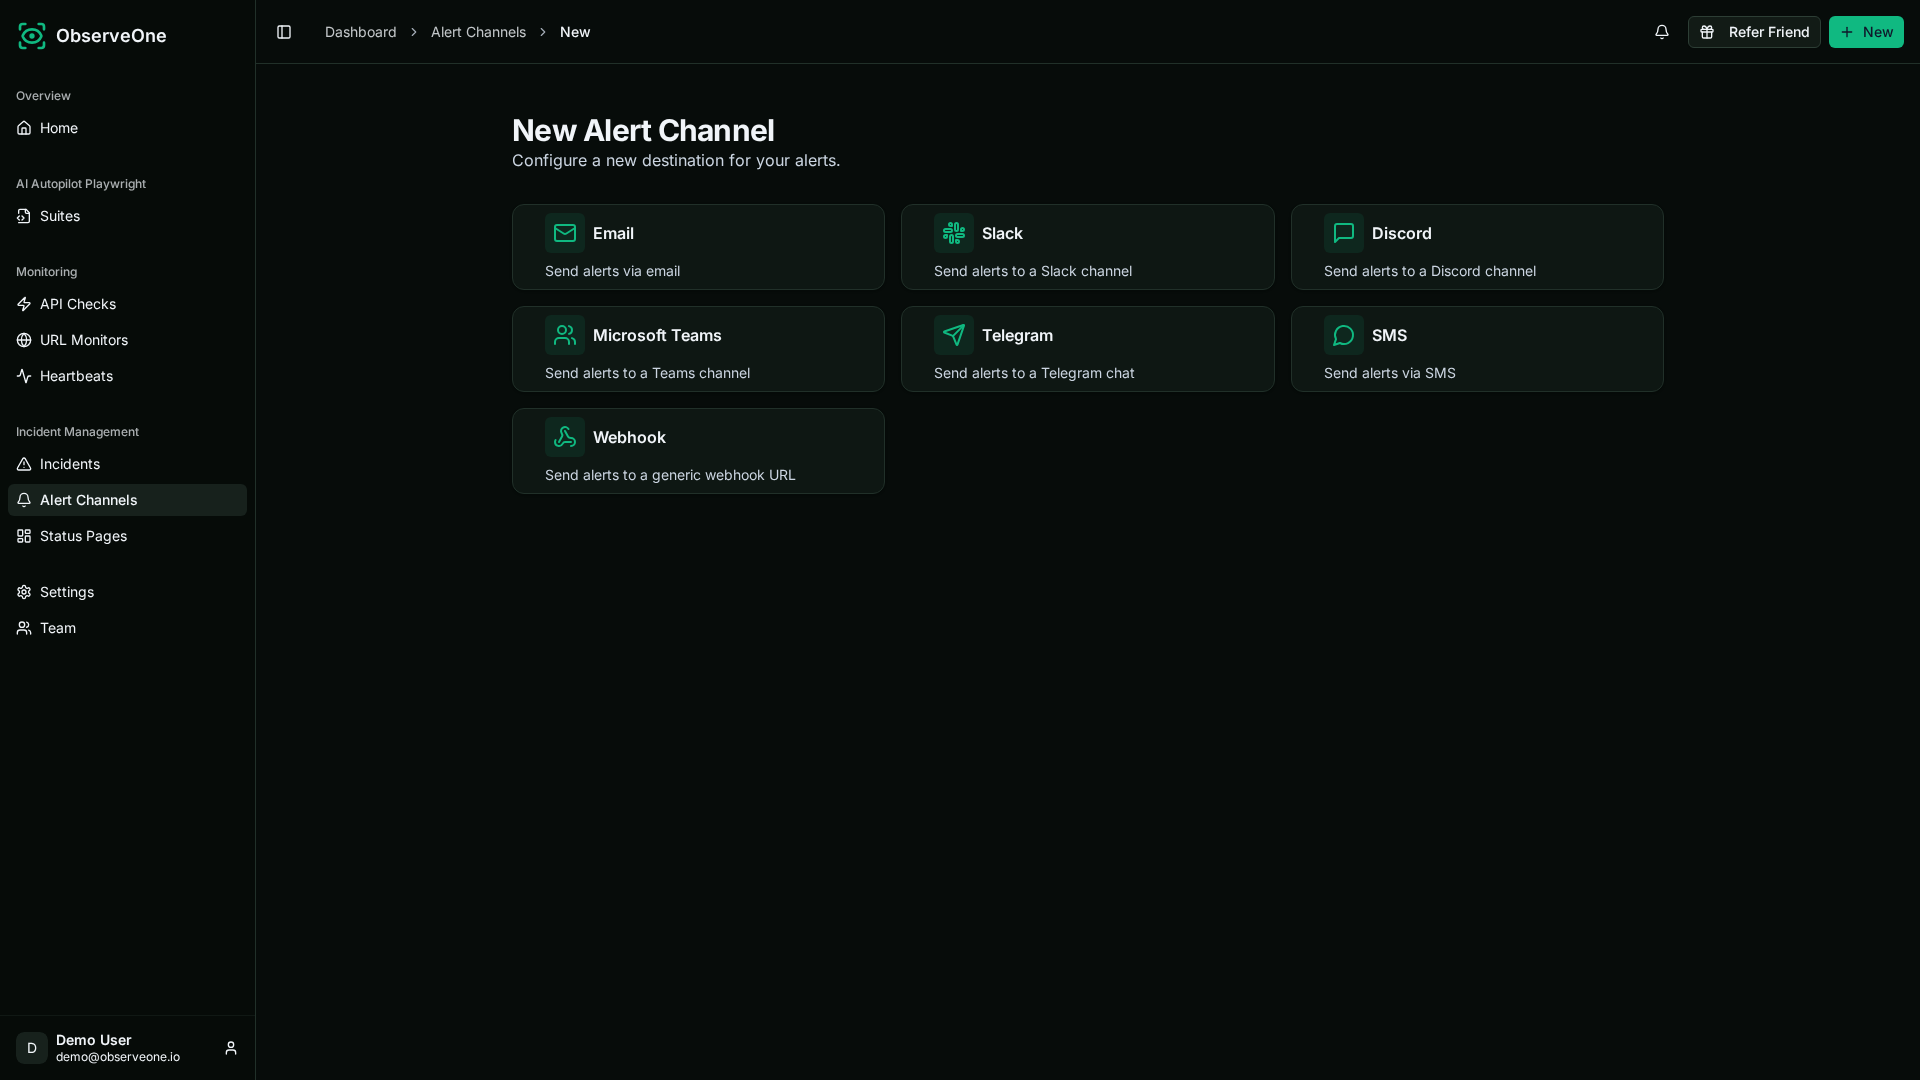
Alert Channels:
- ObserveOne: 7 channel types (Email, Slack, Discord, Teams, Telegram, SMS, Webhook) configured directly in the platform
- Pingdom: email notifications and webhooks only
Status Pages:
- ObserveOne: public status pages with incident details, timelines, and resolution updates
- Pingdom: basic uptime-only status pages (daily dots showing normal/disruption/outage, hosted on
stats.pingdom.com)
ObserveOne's status pages communicate why things are down and what is being done, not just that they are down. Customers see incident context, not just red dots.
Decision Framework: Which Tool for Your Team?#
Choose Pingdom When:#
- Your primary need is classic uptime monitoring with simple HTTP checks
- You want deep page speed analysis with grades, waterfalls, and filmstrip views
- You need Real User Monitoring (RUM) to track actual visitor performance
- You want embeddable uptime/performance badges for public display
- Your alerting workflow is simple: "send alert, we will handle the rest externally"
- You are comfortable with script-based synthetic checks using custom commands
Choose ObserveOne When:#
- Your priority is production monitoring with incidents, alerts, and status pages
- You want AI-generated Playwright suites that self-heal and gate CI without writing scripts
- You need multi-region uptime and API monitoring combined with incident management
- You want heartbeat monitoring for cron jobs, backups, and background processes
- You need public status pages that communicate incident details, not just uptime dots
- You are a developer-led or DevOps team that wants monitoring, incidents, and tests in one platform
The Core Distinction#
Pingdom is an uptime and performance monitoring tool. ObserveOne is a production monitoring and incident platform that also generates and runs Playwright tests with Autopilot. Pick based on which job you are hiring the tool to do.
Conclusion#
You are not choosing between two identical tools; you are choosing what kind of monitoring to lean on. If your priority is classic uptime and performance reporting with page speed grades and RUM, Pingdom is a solid choice. If you care more about catching production incidents early, with multi-region checks, heartbeats, incident workflows, status pages, and Playwright suites that Autopilot writes and heals for you, ObserveOne is the better fit.