The ObserveOne dashboard is the web app at app.observeone.com. Everything the CLI does has a home here, plus the things a terminal is bad at: reading a failed run's trace, watching a suite generate, approving a billing change.
The sidebar#
The left sidebar is grouped by what you are trying to do, not by object type.
| Group | Contains |
|---|---|
| Home | The dashboard itself |
| Autopilot | Suites, the AI-generated browser tests |
| Monitors | API Checks, URL, SSL, TCP, UDP and DB monitors, Heartbeats |
| Respond | Incidents, Alert Channels, Status Pages |
| Configure | Projects, Environments |
Settings and Team sit at the bottom, below the groups.
The + create menu is the fastest way to make anything: an Autopilot suite, any of the five monitor types (URL, SSL, TCP, UDP, DB), a heartbeat, an API check, an incident, or a status page.
The home screen#
What you see on Home depends on how far into setup you are.
Before your first check#
With no checks yet, Home shows only the setup checklist and a hero prompting you to create your first one. There are three core steps:
- Create your first check: paste a URL and Autopilot plans, writes and runs a test for you.
- Watch your first check pass: see a run succeed.
- Add an alert channel: so a failure reaches you in Slack, email or a webhook.
Once two of the three are done, an optional-steps section appears: add a URL monitor, publish a status page, invite a teammate, and trigger runs from CI on every deploy.
You can dismiss the checklist. Re-entry lives in a pill in the sidebar, so dismissing it is not permanent.
Once you have checks#
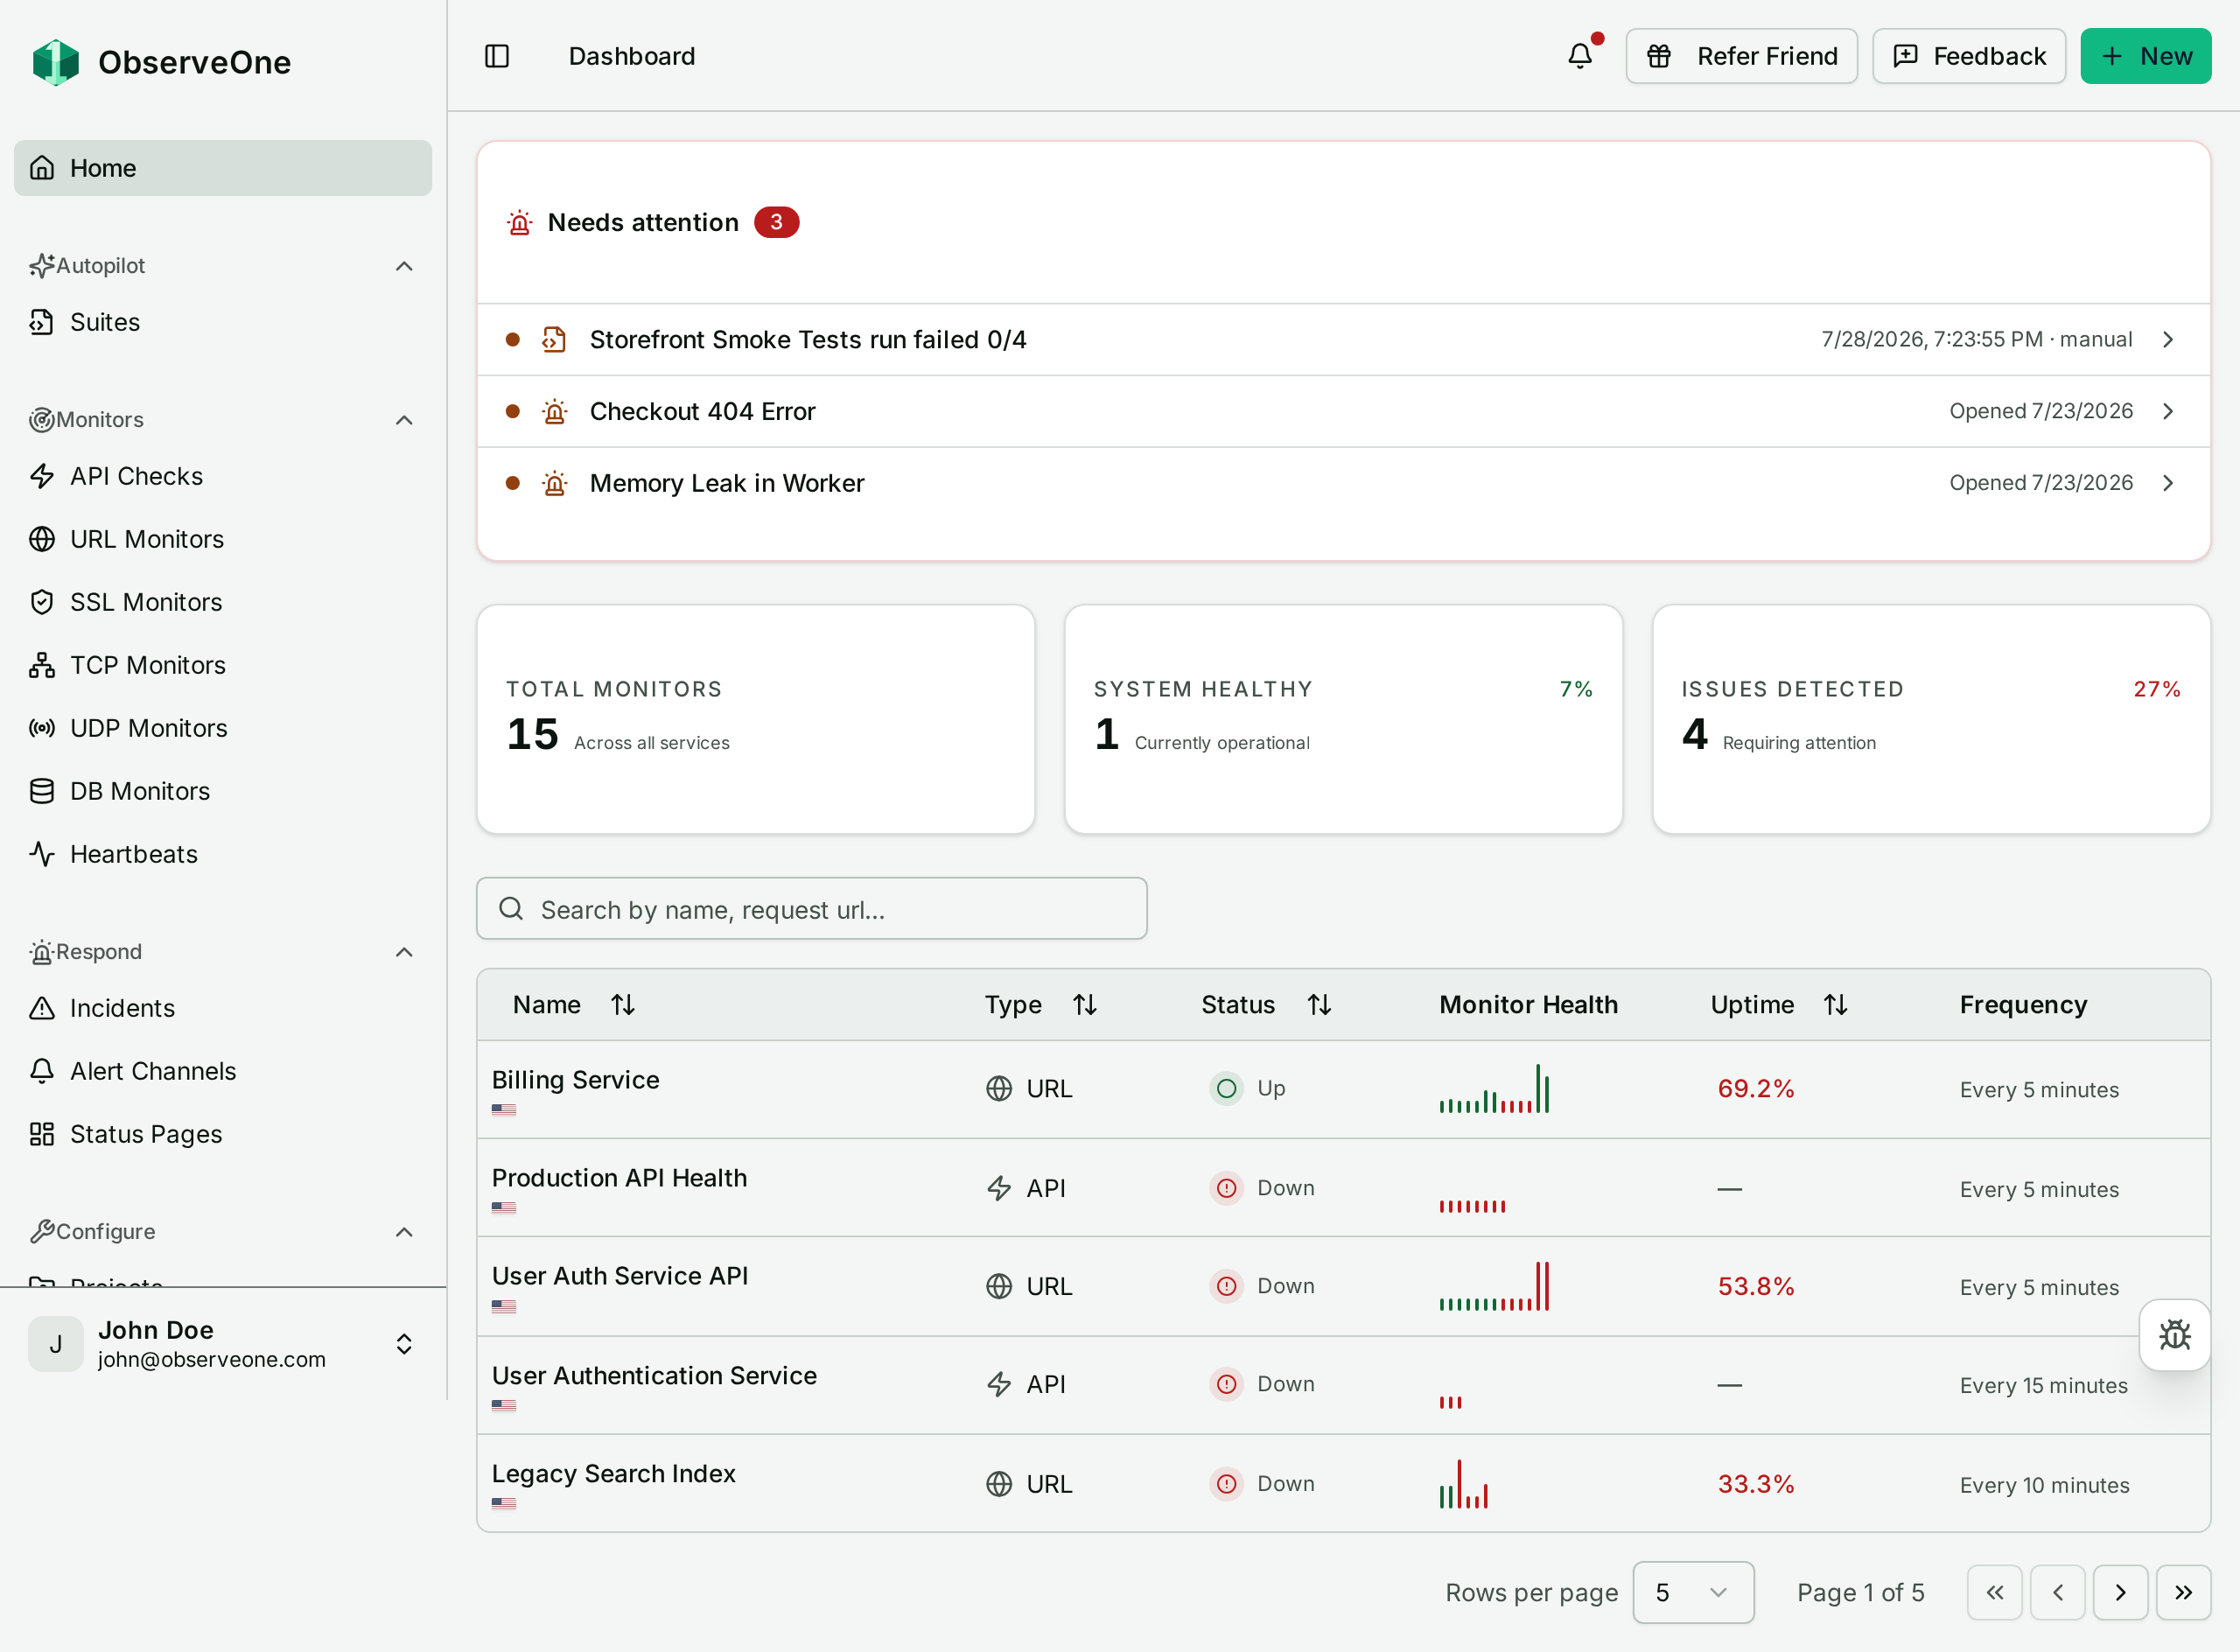
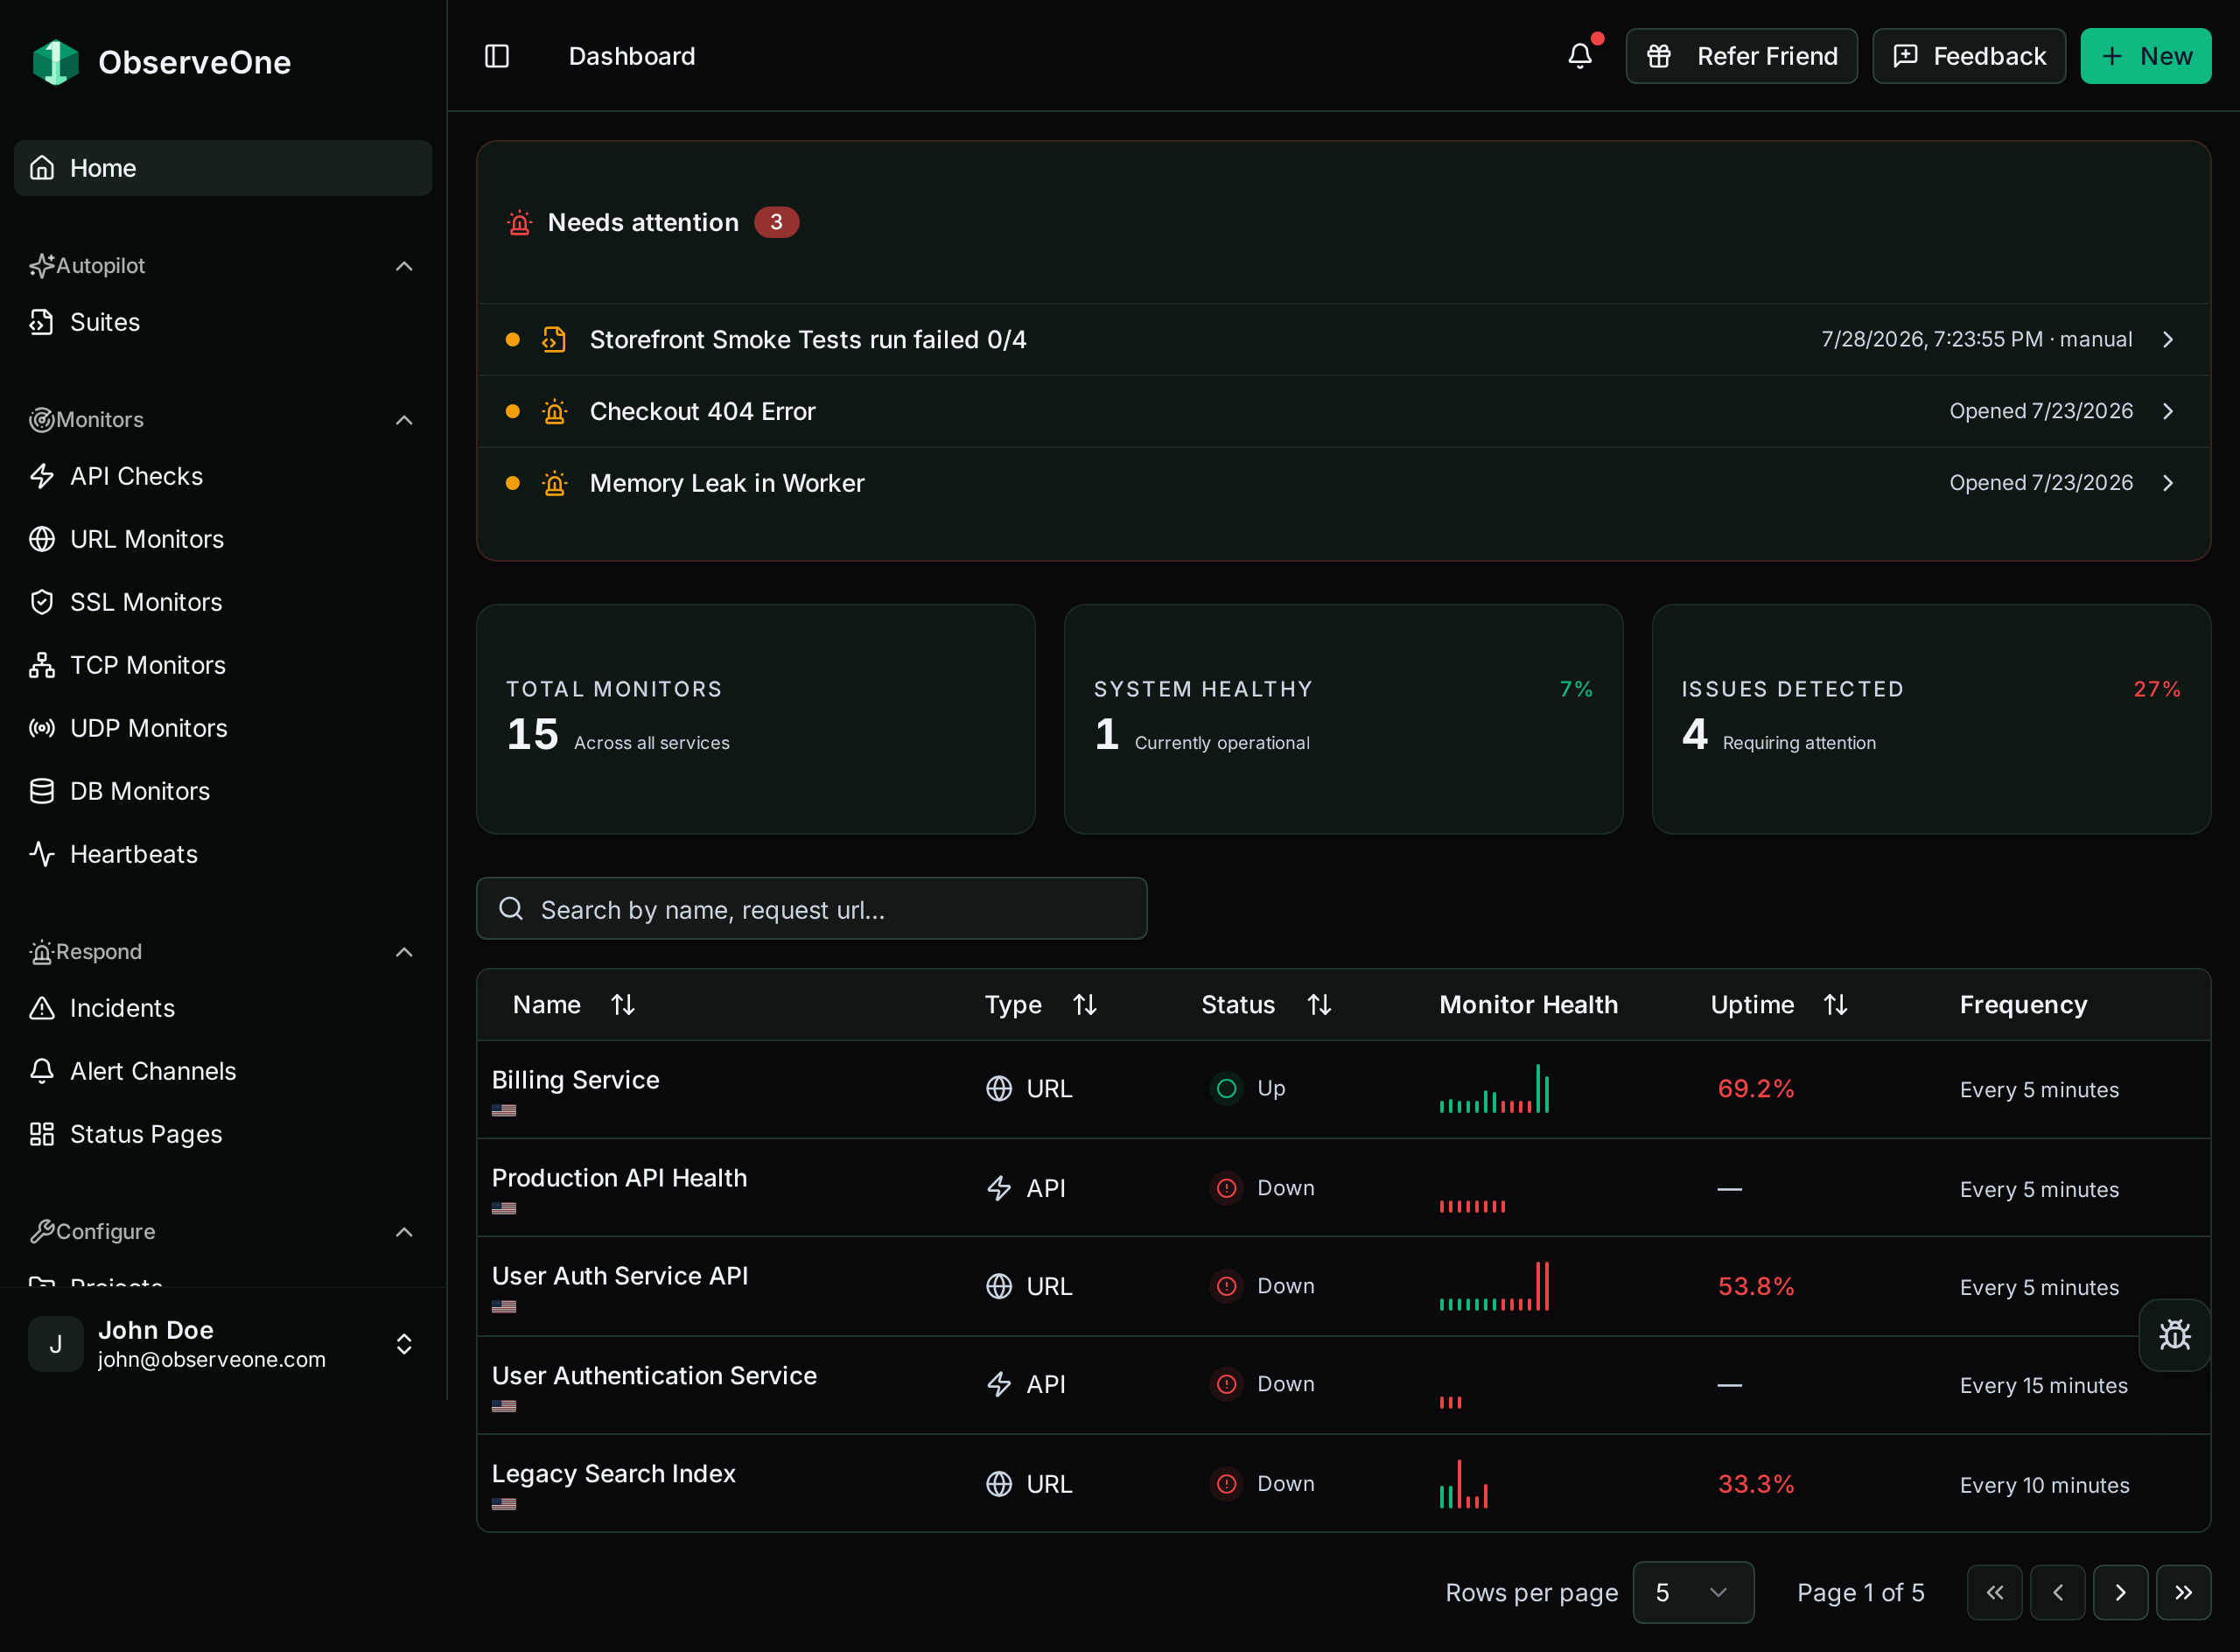
Each Needs attention row is one open problem, tagged by where it came from and linking straight to it. Below the stats cards, the checks list holds every check you own with its latest result; anything without a schedule shows as Manual.
Next steps#
- Autopilot to generate your first browser test.
- Creating monitors in the UI to set up an uptime or protocol monitor.
- Notification channels to get failures delivered somewhere.